
OVERVIEW
This workshop will help you build custom dashboards to present and arrange your data in a way that will help you identify your security gaps easily.
In this workshop, you will :
- Learn about the different widgets and how to modify them
- Create a unique dashboard that will present the data you need
LESSON 1 – WHY DO YOU NEED DASHBOARDS?
SafeBreach platform aggregates massive amounts of data – simulation and test summaries, Threat types, and remediation insights.
arranging the data on customized dashboards can help with:
- Visibility and Monitoring: Organizing data in dashboards enhances real-time monitoring by providing a consolidated view of critical security metrics
- Prioritization of Threats: Arranging data logically enables security analysts to prioritize threats based on severity, improving resource allocation and security posture
- Situational Awareness: Clear organization of data enhances situational awareness, enabling better decision-making and incident response
- Performance Analysis: Structured data in dashboards facilitates trend analysis, helping identify recurring issues and assess the effectiveness of security measures
- Compliance and Reporting: Well-organized dashboards simplify compliance reporting by providing a clear overview of relevant security metrics and incidents
- User Experience: Neatly arranged data improves user experience, reducing cognitive load and enabling faster and more accurate threat detection and response
- Customization and Flexibility: Flexible dashboard layouts allow customization to meet specific security needs, ensuring relevance and usefulness over time
Understanding The Audience
There are different stakeholders within the organization. Each one of them will look for different details in a dashboard. These are some typical examples of interests:

Chief Information Security Officer (CISO)
The CISO relies on security control dashboards to gain insights into the organization’s security posture and identify potential risks.
“What is the current overall security posture?”

Executive Management
Executive management of an enterprise will typically look for clear and concise summaries of key cybersecurity metrics and KPIs that demonstrate the organization’s overall security posture and alignment with business objectives.
“Are we achieving our business cybersecurity KPIs?”

Information Technology (IT) Department
The IT department of an enterprise will typically look for detailed technical information and actionable insights regarding security incidents, vulnerabilities, and the effectiveness of security controls to ensure the protection of IT assets and infrastructure.

Incident Response Team
The Incident Response team of an enterprise will typically look for real-time alerts, incident details, and response metrics to effectively detect, investigate, and mitigate security incidents in a timely manner.
“What ports and protocols need to be blocked?”
LESSON 2 – DASHBOARDS BY USE-CASE
You can also build custom dashboards for a specific use case. If you want to check your endpoints, you can build a dashboard to monitor their vulnerabilities. It is the same for the latest known threat validation and MITRE-oriented dashboards.
Here are some examples of use-case-oriented dashboards. Hover over the hotspots to learn about the widgets.
Threat Assessment Dashboard:
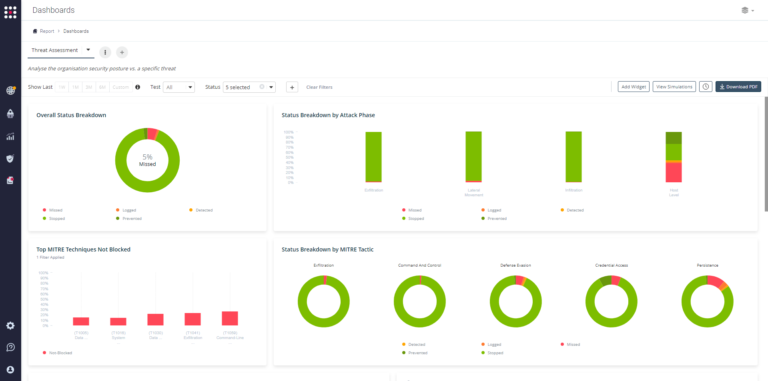
This dashboard includes data relevant for the Incident Response Team because it provides accurate data about the organization’s security posture against different types of threats. It can also be usable for a CISO in an MITRE-oriented organization.
Return-On-Investment(ROI) Dashboard:
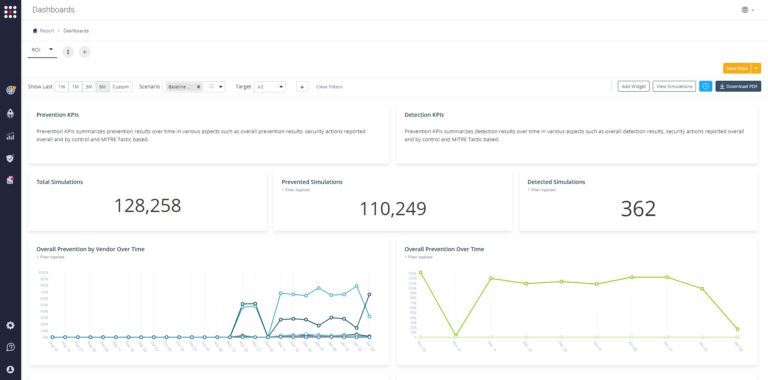
This dashboard is relevant for the organization’s CISO and Executive Management because it presents the data that will help them make decisions regarding their security plans. They can easily see which of the security controls they invested money in is giving value to the organization, and they will probably want to see an increase in the organization’s security posture over time.
US-CERT Alerts Dashboard:
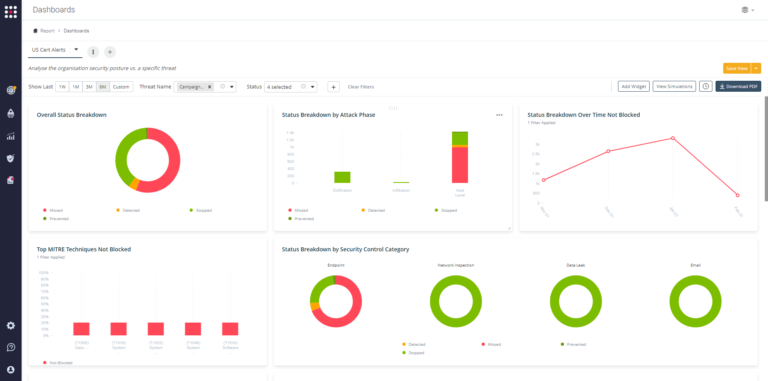
This dashboard is relevant for the organization’s CISO because it presents the relevant data for the latest US-CERT alert scenarios, so it provides the CISO with an estimation of the current security posture against the latest and upcoming threats.
LESSON 3 – Essential Components
To create the best dashboard, you will need to combine widgets that together will expose a full picture. When customizing your own dashboard, we recommend you to use these principals:
Aggregative vs over time trend
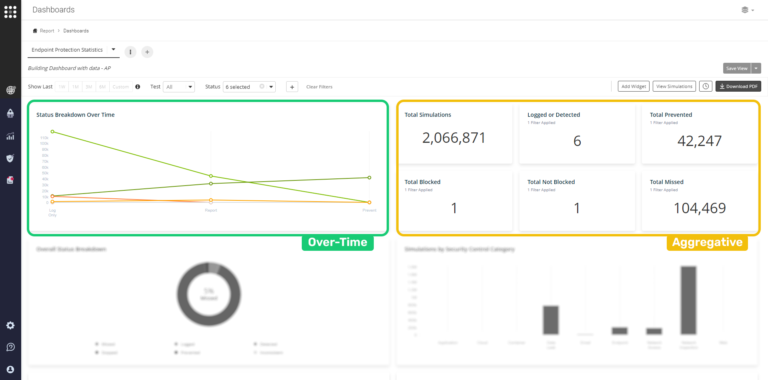
Combine aggregative current data and over-time graphs to receive more value from the dashboard.
Key Performance Indicators (KPIs)
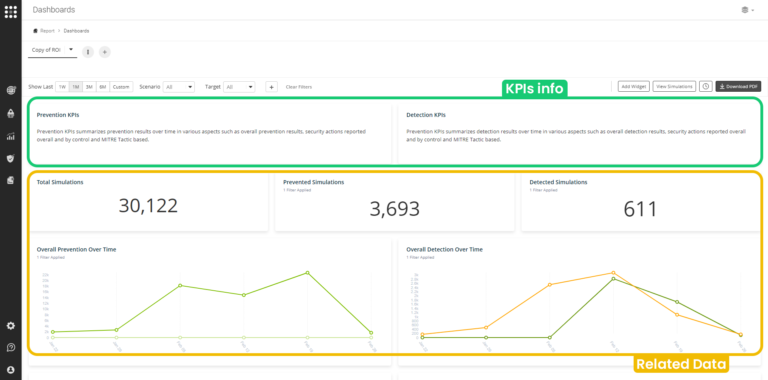
Place the KPIs description on the dashboard itself, along with the related data that will allow you to measure them.
In order to know what are the necessary widgets for your dashboard, you need to ask yourself some key questions:
- Where should I focus my efforts?
- Does the reality of what the testing found match the results I expected?
- How does location A compare to location B?
- How does this test compare to the last test?
- Are there any urgent issues?
- Operational/Usage Data – Have I done testing in my entire environment (on all simulators)?
- Operational/Usage Data – Have I run enough attack types to a full measurement of posture?
Congratulations !
You have finished the course. Are you ready for the next one? well.. not yet.