
ANALYZE YOUR DATA
After you ran some tests, you have data to work with. In this section of the onboarding journey, you will learn about the data analysis methods. You will learn how to build your dashboard, with some helpful widgets, and you will learn how to choose the behavioral remediation methods that will reduce your risk score.

This section’s objectives are:
- Allow simulator files to run by adding them to the Allowlist
- Configure impersonated users with representative privileges
- Configure your security control and other integrations
- Conduct a “kickoff call” with your customer success manager
Remediation methods in this section:
Choose the security control category, observe the missed attacks and remediate behaviorally.
Observe the insights, understand the meaning of each one, use the provided data and take action.
Choose a pre-made dashboard or create one from scratch by adding widgets. Monitor your network’s status and vulnerabilities, Choose remediation methods and take action.
Made for MITRE-oriented security. Choose a MITRE tactic and get insightful data for remediation.
Section 1 – Undestand Your Results
Every simulation will end up with one of six statuses, so first of all, let’s understand their meaning:
Method 1 – Security Posture Filteration
The best way to start your data analysis is to use the Security Posture filter. Start by observing the score over time and see if anything has changed.
Click on the period buttons:
The categories visualize the weak points of your network.
Choose one of the security control categories that you want to improve and dive in:
The list shows the missed attacks in the category that you chose. There are remediation recommendations for each one of them. Look for a method that you can implement in your organization.
Observe the remediation recommendations:
Method 2 – Insights Panel Guidance
Another tool for remediation is SafeBreach Insights (found under Remediation in the left panel). The tool aggregates all the current available remediation methods on one screen. The most severe issue will appear in the upper left corner.
By clicking on each one of the Insights, an action window will appear. Read the remediation Action and use the additional Actionable Data to remediate the issue.
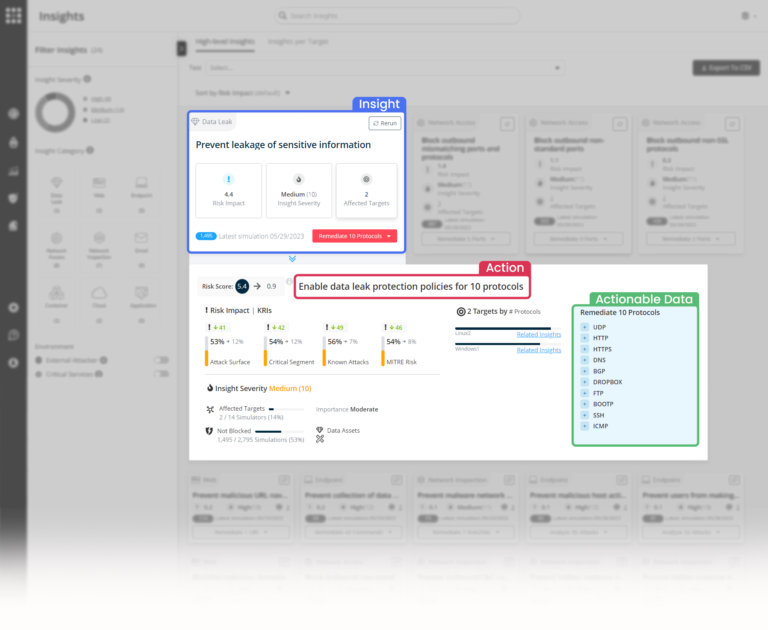
This insight warns about possible leakage paths. DLP policies need to be enabled to prevent it.
In the Actionable Data section, you can see mismatches between ports and protocols – For example, if we see that data was transferred over HTTPS via port 80, you might want to block/prevent this communication path for the future.
You will use the actionable data – ports and protocols, and block them on the machines represented by the target simulators.
Here is an example of a useful insight – which helps you by displaying the commands that ran in the simulations by users with insufficient permissions.
You can observe the list of commands and choose which of them you want to block, so “weak” users won’t be able to run them. Some of these commands can be exploited in the future.
To fully use this ability and try to run the commands from multiple users, it’s important to configure some Impersonated Users.

Impersonated Users
SafeBreach can execute operations while impersonating each type of user according to its privileges. To configure, go to Environment -> Impersonated Users.
Method 3 – Dashboards Customization
Another way to filter relevant data and get remediation insights is by creating a custom dashboard or modifying an existing one. Let’s learn how to do it.
Click on the + icon and create a new dashboard:
Click on Add Widget and choose the “Status Breakdown Over Time” widget:
Add more widgets and create your valuable and custom dashboard.
After doing that, you can filter and see the change in your posture by clicking on the Show Last buttons:

Every one of the graphs and widget elements is clickable, so you can identify your weakest points and filtering the results with accuracy:
Now it’s easy to focus on the issue that you want to solve. Choose the simulation result that you want to fix and check the remediation recommendations. Change your network’s behavior accordingly:

Run the test again
After remediation action, it is very important to run the same tests again and again. The data collected from attacks and scenarios will be helpful for generating new remediation methods and evaluation of the current risk score.
Method 4 – MITRE ATT&CK Remediation
Another way to filter relevant data and get remediation insight is by dividing it into a MITRE ATT&CK table. The MITRE ATT&CK board displays your security posture as a heatmap, so you will be able to focus on the breach techniques that you want to focus on.
Go to the MITRE ATT&CK Board:
The board is divided to Tactics and Techniques:
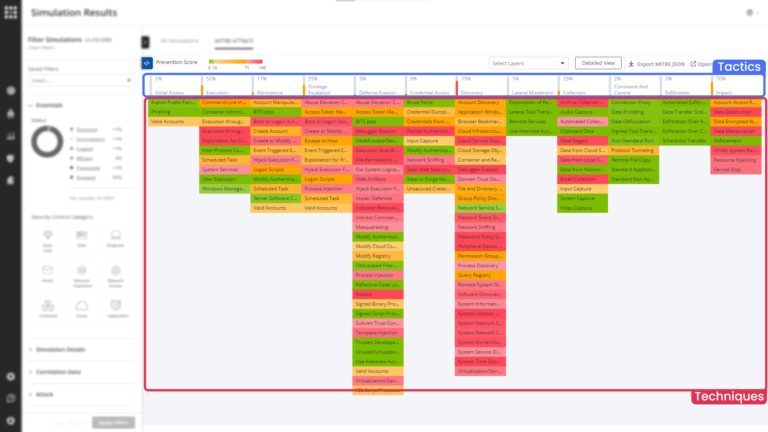
Choose the Technique that you want to focus on. The results will be filtered accordingly:
For creative remediation ideas, you can always click on the MITRE technique shortcut to receive some useful information that will help you in the remediation process, specifically for the chosen technique.
Click on the MITRE technique shortcut:

Congratulations !
You have finished the step.
Proceed to the next section – Final Steps